

The Art of Data Storytelling for Businesses: Bringing Insights to Life
Data is everywhere today. From the apps we use to browse social media to the online shopping purchases we make, our digital footsteps create massive amounts of data. Companies large and small accumulate vast troves of data on customer interactions, sales metrics, website traffic, manufacturing processes, and more.
Hidden within all of this data are valuable insights about customers, operations, risks, and opportunities. But making sense of endless rows and columns of numbers in spreadsheets can seem daunting for many business professionals and managers. This is where the art of data storytelling for business comes in.
What is Data Storytelling?
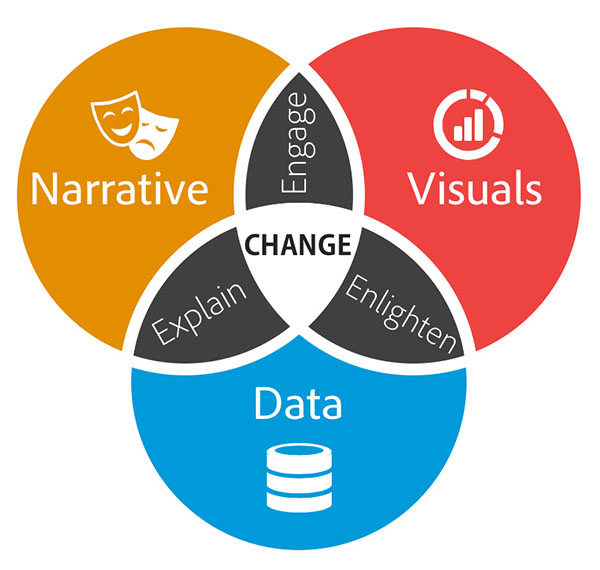
Data storytelling involves crafting compelling narratives to explain the patterns, trends, and key takeaways uncovered through data analysis. It goes beyond visualizing analytics and numbers to interpret what the data means. Skilled data storytellers combine data-driven insights with engaging, informative stories tailored to a specific audience. They help simplify complex information and make it memorable using vivid language, captivating visuals, and impactful story structures.
Elements of Great Data Stories
How to tell a story with data, you ask? Great data stories often have common elements that connect with audiences on an emotional level and prompt action on the key insights. Here are some hallmarks of effective data storytelling:
- Relatable characters and scenarios – Using descriptive examples, hypothetical characters, and settings helps make data insights more tangible. This builds understanding and empathy.
- Dramatic arcs – Structuring the narrative to have a beginning, middle, and end creates tension and interest like good books and movies. Obstacles, conflicts, and resolutions are story devices that can highlight important trends.
- Memorable data visualization – Charts, graphs, illustrations and other visuals encode numbers and statistics into easily digestible formats that stick in the minds of audiences and reinforce key points. Many useful data visualization tools exist, such as Tableau, Power BI, Excel charts, Infogram and more. For those looking to learn data visualization techniques, helpful online resources include data visualization beginner tutorials from Chartio, data storytelling courses from Norton Norwitz, and data visualization ebooks like Storytelling with Data by Wiley. These resources offer guidance on presenting data narratives in visually appealing ways that optimize comprehension and recall.
- Concise language – Using simple, clear, and vivid language avoids getting bogged down in jargon and technical terms. This keeps audiences engaged.
- Customized messaging – Tailoring vocabulary, concepts, examples and takeaways for the knowledge level and interests of business managers versus data analysts, for instance, facilitates comprehension.
- Clear call to action – Leading the audience toward next steps or specific decisions provides a clear pathway to act on the insights shared through data storytelling.
Data Storytelling in Action
Many real-world data storytelling examples illustrate the power of this technique:
- A health organization uses data stories with interactive maps and graphs to showcase treatment gaps in different cities related to the opioid crisis. This spurs community leaders to allocate more funding for addiction medicine clinics.
- An energy company unveils data narratives each quarter explaining emerging consumption trends, like the impacts of electric vehicle adoption. This helps government leaders craft policies to meet sustainability goals.
- A retail chain unveils a data story at an annual conference tracing the customer journey from initial ad exposure to point-of-sale. This shows merchandising teams where to fine tune marketing strategies.
- A sports team creates a compelling data story for fans showing how player performance correlates with championship wins. These fun stories drive ticket sales and merchandising revenues.
Data storytelling makes digesting volumes of statistics, spreadsheets, and analytical outputs much less daunting. It provides a powerful way for today's data-rich organizations to inform, inspire, and engage internal and external stakeholders. With insightful narratives reinforced by compelling data visuals, numbers leap off the page. And key insights spring to life allowing better, faster decision making.
For any business leader or manager struggling to synthesize complex data points, focusing on crafting compelling data stories can make the numbers more approachable and actionable. Using the elements and best practices of effective data storytelling covered in this article, you’ll be on your way to bringing your organization’s data insights to life through impactful narratives that drive business value.

Check out our SmartWorlder section to read more about smart technologies.